
Training Registration
Data Visualisation Bootcamp
INTRODUCTION
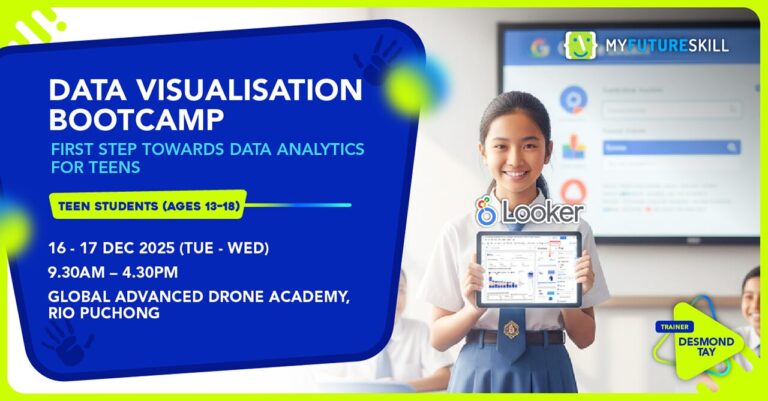
In schools today, students often collect data for science experiments, surveys, or project work — yet many struggle to turn numbers into meaningful stories. That’s where data visualisation helps. It enables students to organise, analyse, and present findings clearly — turning spreadsheets into interactive charts, dashboards, and insights. These are the same skills used in universities and modern workplaces. In this 2-day workshop, students will learn to use Google Looker Studio, a cloud-based tool that goes beyond Excel. They’ll discover how simple school surveys can become dashboards that reveal patterns and insights. By mastering the basics of data visualisation and analytics, students will:
• Save time preparing reports and presentations
• Build logical thinking and problem-solving skills
• Get early exposure to tools used by data professionals
This program gives teens the confidence to manage data smartly — a key advantage for both school and future careers in a data-driven world.
LEARNING OBJECTIVES
By the end of the program, students will be able to:
- Understand the purpose and value of data visualisation
- Use Google Looker Studio confidently to build simple dashboards
- Analyse and communicate insights from real or school-related data
- Present information clearly and creatively for reports or projects
- Build curiosity and confidence in data — a foundation for future study in analytics, computing, or design
FEE
Early Bird Offer (before 28 Nov 2025) – RM660
Special Offer (before 12 Dec 2025) – RM700
Normal Fee – RM740
We provide Printed Course Aids, Lunches, Refreshments & Certificate of Completion.